Graph Literacy
Graph literacy is the ability to identify important features of graphs and relate those features to the context of the graphs—in other words, to increase students' understanding of the meaning of graphs. Graph literacy is emphasized in both the Common Core State Standards for Mathematics and the Next Generation Science Standards.
The Graph Literacy project developed activities using SmartGraphs technology to specifically improve graph comprehension in grade 7 and 8 science students.

Activities
PLEASE NOTE: Graph Literacy activities are not assignable like other resources on learn.concord.org and do not save student data. You can, however, share them with your students by using the Links feature for classes. To do so, copy the URL of an activity below, navigate to your class, and click the Links button below the class's name in the left hand navbar. Click the Create Link button to create the link. When your students log in, they will see the link under the heading Class Links. More details on class links are provided in the user guide.
 1.2 Equivalent Graphs
Students investigate graphs that are equivalent, in the sense that they represent the same data, though they look different because they employ different scales. (Addresses Graph Literacy Objective 1.2: Understand how zooming, panning, stretching, and shrinking do not change the data within a graph.)
» A Lesson Plan is also available.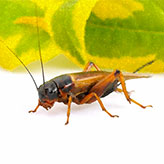 1.3 Interpolation
Students explore experimental data of cricket chirping rate to find linear trends on graphs. They use this trend to interpolate values and then find the corresponding linear equations. (Addresses Graph Literacy Objective 1.3: Interpolate between points on a graph.)
» A Lesson Plan is also available. 1.4 Independent and Dependent Variables
For various scenarios students select which of two variables should be considered independent and which dependent, and to explain their choice. (Addresses Graph Literacy Objective 1.4: Determine the dependent and independent variables for display on a graph.)
» A Lesson Plan is also available. 2.1 Graphs Tell a Story
Students match a word story to the correct set of graphs involving temperature change over time. (Addresses Graph Literacy Objective 2.1: Identify the overall shape and direction of a line graph, and connect the shape with the real-world meaning.)
» A Lesson Plan is also available.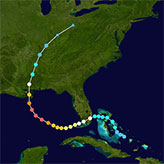 2.2 Hurricane Katrina
Students are given graphs relating to Katrina, the hurricane that devastated New Orleans and much of the gulf coast in 2005, and are asked to identify various events, such as the moment when the hurricane made its closest approach to New Orleans. (Addresses Graph Literacy Objective 2.2: Identify the maxima and minima of a graph and interpret their meaning.)
» A Lesson Plan is also available. 2.3 Growing Up
This activity asks students to interpret the slope of sections of a line graph of the height of U.S. girls and boys from ages two to twenty. (Addresses Graph Literacy Objective 2.3: Estimate the slope of a line and describe its real-world meaning.)
» A Lesson Plan is also available. 4.1 Population Curve: Significance of Breakpoints
The logistic curve, or S-curve, is important in understanding how populations change over time. It's a complex curve that can be analyzed with a linear fit to help identify the breakpoints where changes of growth rate occur. This activity brings together many graph interpretation skills, and puts them to use to design and analyze a population experiment using the ubiquitous aquatic plant, duckweed.
» A Lesson Plan is also available.