Listen to Data
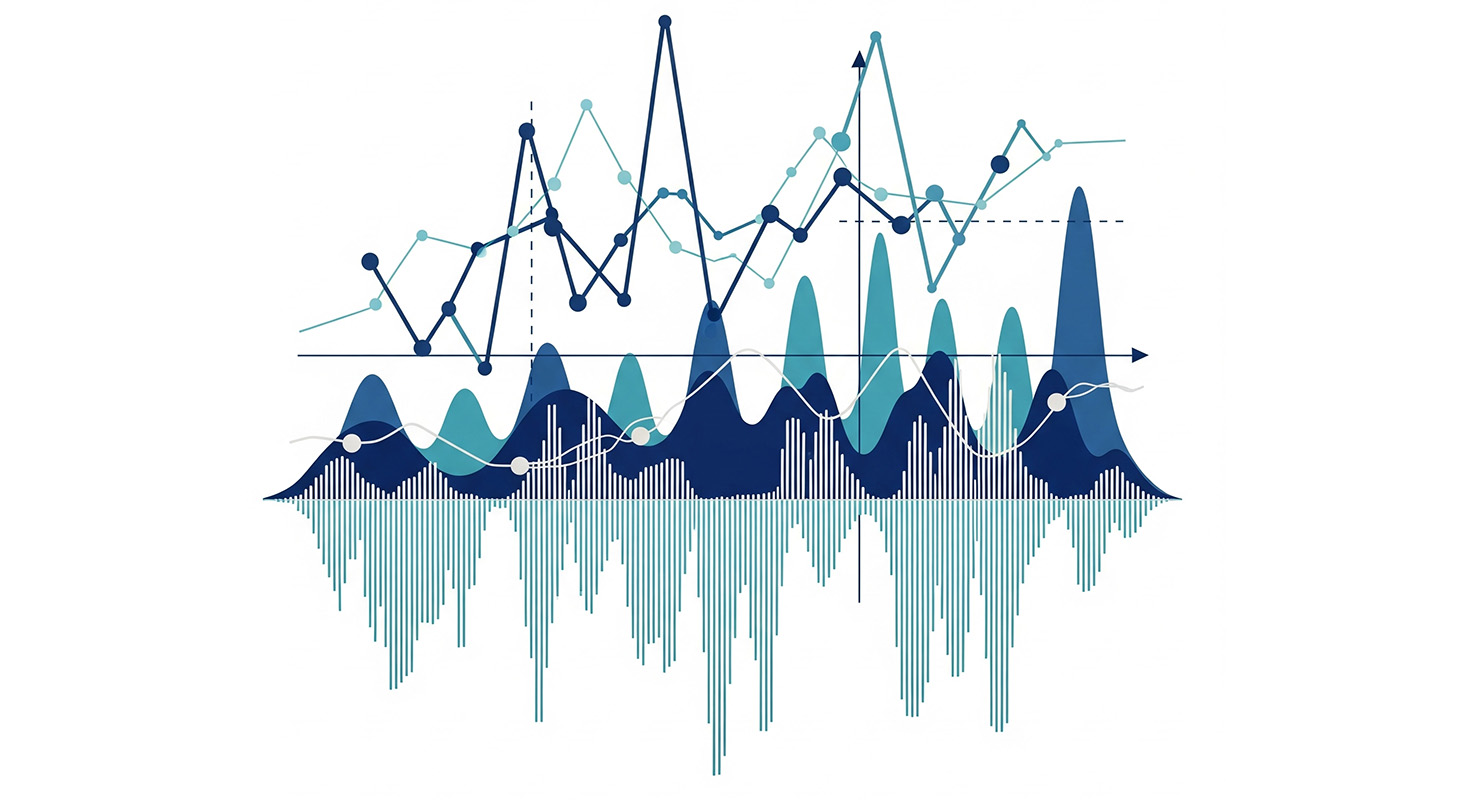 In addition to being able to create graphs in the Common Online Data Analysis Platform (CODAP), it is possible to sonify time-series data to hear how values change over time. Using the built-in Sonify plugin, you can play the sound of a graph in CODAP. This practice is called “data sonification.” Higher pitches represent higher values and lower pitches represent lower values. Following a tutorial on how to use the Sonify plugin, the activities below have you sonify data on how cases of infectious diseases (or the prevalence of virus particles in wastewater) change over time. In addition, there are two activities looking at changes in climate data over multiple decades. The activities are designed for students in grades 6-12 and up.
These activities were made possible through the National Science Foundation-funded COVID-Inspired Data Science Education through Epidemiology (CIDSEE) project, a collaboration between Tumblehome, Inc., Concord Consortium, and several other partners.
Sonification Resources
This material is based upon work supported by the National Science Foundation under Grant No. DRL-2313212. Any opinions, findings, and conclusions or recommendations expressed in this material are those of the author(s) and do not necessarily reflect the views of the National Science Foundation.